In-Product Survey
Connected survey data with user behavior metrics to craft compelling data narratives. The initial case informed 4 projects inside the A/B Testing team. The solution was also scaled across the Ads organization.
Context | In-Product Survey at Meta Ads
Sample Size Issue
- Historically, the in-product survey was implemented statically in the corner of UI, resulting in a low response rate.
- Cool down period policy.
Lack of Context
When a user gives a 5-star or 1-star rating, the research team lacked context regarding what led to the satisfaction or frustration.
Cross-Function Buy-in
Due to the issues mentioned above, the Research function deprioritized this approach, considering it a low return on investment.
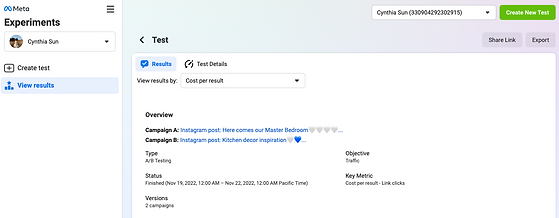
A/B Testing Team Use Case
In H2 22, the A/B Testing team identified improving user retention as a main theme, and this survey played a pivotal role in identifying potential root causes on a large scale.
Pain points to validate:
1. Budget: Do users perceive the A/B Testing product as expensive, and if so, why?
2. Test Quality: Are users experiencing confusing results, such as a declared winner despite one cell being empty?
3. Test Efficiency: Do users feel that it takes too long to gather results?
Most importantly, could any of these factors potentially lead to user churn?
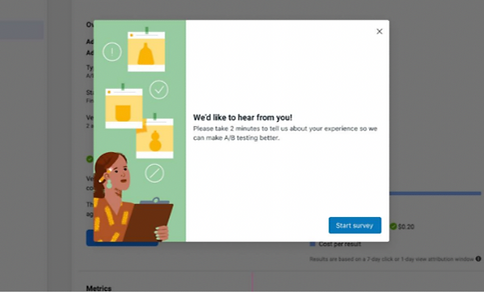
The Survey:

Q1: Overall how satisfied are you with the results of this test?
From very dissatisfied to very satisfied, there are 5 response options. If the response is negative, then there's a followup question to ask the reason for being dissatisfied. "Please explain why you chose...(response)"
- It required too much ad budget.
- I don't know what to do next/ There's a publishing or delivery issue.
- Test Efficiency Related, etc.
Q2: How likely are you to use A/B Testing again?
From very unlikely to very likely, there are 5 response options.
This survey is a multi-question in-product survey that is triggered when users view their test results and exit the report page.
Analysis:
1. Sanity check
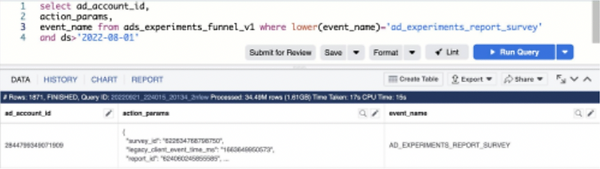
2. Survey result automation
3. Analytics dive deep: use logging data to combine survey and user behavior analysis.
Survey_id
- Survey star rating
- Dissatisfaction Reasons
User_id
- Advertiser expertise eg. Basic/Advanced
- Industry
- Spending pattern, etc
Report_id
- Test Result eg. winner/no winner
- Test Setup eg. Budget Spent, duration,
- Performance of Ads that're part of a test.
Key Insights:
- There is a strong correlation between a user's sentiment toward the current product experience and their willingness to return.
- The top potential root cause evaluated for causing user dissatisfaction/churn are:
Outcome:
- Four projects were roadmapped based on the insights gathered. A selection of the artifacts is listed here.
- The analysis set the tone for H1 23 roadmapping as reducing 'Advertiser Friction', and secured continued investment in improving product user experience.
- Three out of four projects achieved stat-sig positive impact in H1 23, measured through causal inference.
Pain Points Evidence Root Causes
Users perceive the A/B Testing product as expensive
Poor Test Quality
Test Efficiency
Supported
Supported
Not Supported
Users lack guidance on setting up test budgets, interpreting results, and understanding the best practices for next steps
Schedule misalignment and signal loss is causing one-cell empty.
-
Scale the Solution
1. Internal conference presentation.
2. Received buy-in from the UX Research function.
3. Led the creation, documentation, and sharing of In-product Survey Best Practices.
Outcome:
- Two additional teams have been leveraging the best practice to build and analyze in-product surveys.
- Secured investments in improving the survey review process.
Learning
Leading is never about authority. It is about painting a mutual goal, so we could work towards the same direction. It’s about building win-win scenarios.